25
06
.21
SoDis update
SoDis is about visualising measures of busyness to support people’s decisions about the places and spaces they visit. With that in mind, it became far too quiet with the restrictions in place for us to undertake our Human Counting Study in the Computer Science building as planned. As students returned to campus, we gained approval to run our study in UK-based university buildings by staff and students, subject to approval from building managers. We made enquiries of available WiFi data and found the busiest buildings. It will come as no surprise that they were all on University Park.
First we approached Portland Building’s managers as they have the most number of visitors on any given day. The nature of the traffic through Portland’s many doorways was explained to us. There were many visitors, entering and exiting from several doors. People’s movements into and out of the building were multi-directional and fast-moving. It was apparent that Portland required more SoDis researchers to undertake our counting study than were available.
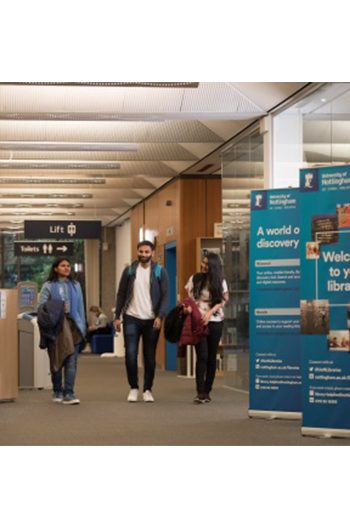
We then approached Hallward Library building managers about SoDis. Although Hallward Library is in one of the busiest buildings on University Park campus, access is mostly restricted to the front doors. There is a separate entrance to the café and one for the Main Security Office on the Lower Ground floor. People do not tend to be moving quickly through the building. Most visitors enter to either study or find resources. These features all made Hallward amenable to our study.
We could not have asked for a more welcoming and supportive response than the librarian team offered! With help from the librarians we found suitable places for us to place two WiSeBoxes on each of the four floors of the library building. The library staff organised an orientation session for our research team. Over 3 weeks in May, our SoDis research team ran the Human Counting Study to gauge how busy the building was. We undertook 10 x 4-hour shifts to capture the equivalent of a 40-hour work-week. Dominic Price developed a web-based counter to make data collection straightforward. Researcher’s positioned at the three doorways, tallied people as they entered and exited. Twice every hour, inside the Library, researchers counted how many people were on each of the four floors. Using printed floor plans, researchers followed a pre-defined path and tallied the number of people they saw in each of the zones marked out on their floor plans.
The data collected from counting people, WiSeBox data and anonymised data captured by established systems managed by IT and by the libraries will all be utilised to better understand busyness in the building. From data collected, we will build visualisations of busyness to be explored in a focus group study, to follow next. The focus group study will involve staff, students and visitors who spend some time on the campus, and those who have not been on campus for some months, but are expected to return in 2021-2022. The aim of the focus group is to explore what people understand by and how they respond to various visualisations of busyness.
Written by Pepi Barnard
Tags:
data,
trust,
trusted,
WiFi,
WiseParks


